|
Stream Bank and Bar Erosion Contributions and Land Use Influence on Suspended Sediment Loads in Two Ozark Watersheds, Southeast MissouriAbstract
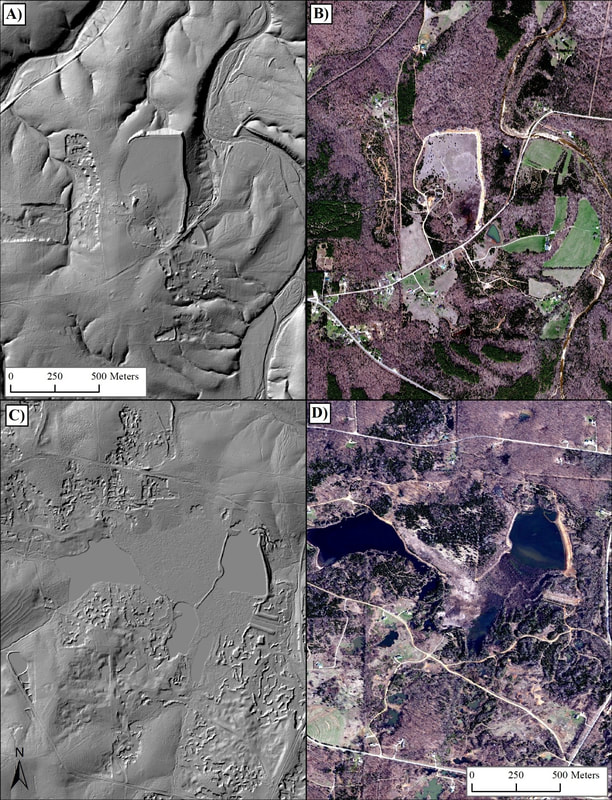
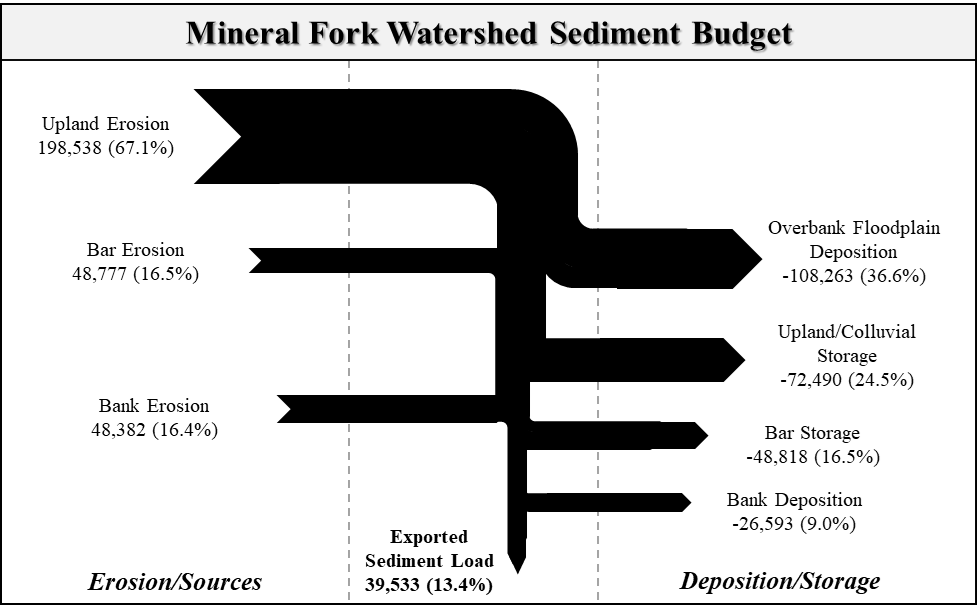
In-channel sources and storages of fine-sediment such as in banks and bars can influence sediment loads and overall geomorphic activity in stream systems. However, in-channel processes and effects on sediment load are rarely quantified in geomorphic or water quality studies. This study uses a sediment budget approach to assess the influence of bank erosion and bar deposition on fine sediment loads in Mineral Fork (491 km2) and Mill Creek (133 km2) watersheds located in the Ozark Highlands in Washington County, Missouri. These watersheds were disturbed by historical lead and barite mining which included the construction of large tailings dams across headwater valleys. USEPA’s Spreadsheet Tool for Estimating Pollutant Loads (STEPL) was used to quantify suspended sediment delivery from upland areas and assess land use-load relationships. Aerial photographs from 1995 and 2015 were used to identify spatial patterns of erosion and deposition in bank and bar forms. LiDAR was used to characterize the channel network and determine bank and bar heights. Field measurements were used to ground-truth bank and bar heights and fine-sediment composition of alluvial deposits. Historical tailings dams capture runoff from 27% of Mineral Fork and 28% of Mill Creek drainage areas, trapping 38% and 26% of the suspended sediment load annually, respectively. The total annual sediment yield for Mineral Fork watershed was 92 Mg/km2/yr with 55% released by bank erosion and <1% reduced by bar storage. The sediment yield for Mill Creek was 99 Mg/km2/yr with 33% released by bank erosion and 24% reduced by bar storage. These results indicate that in-channel processes are important contributors to sediment yields in these watersheds. |
Post-Harvest Activity Assessment using the U.S. Forest Service’s Forest Soil Disturbance Monitoring Protocol (FSDMP), Mark Twain National Forest, MissouriPurpose and Scope
The United States Forest Service (USFS) has contracted the Ozarks Environmental and Water Resources Institute (OEWRI) to perform the Forest Soil Disturbance Monitoring Protocol (FSDMP) within the Mark Twain National Forest (MTNF) in southern Missouri. The FSDMP is a national monitoring program designed to assess the extent of ground disturbance during timber harvest activity and to quantify changes to the landscape that may affect long-term sustainability of the site (Dumroese et al. 2009). This is the first time this type of monitoring has been performed within the MTNF and results of this study will be used to refine the FSDMP to adequately access the impact of timber harvest on variable Ozarks landscapes. The overall goal of this project is to use the FSDMP to monitor different areas within the MTNF and assess the effectiveness of the FSDMP as a monitoring tool. Specific objectives of Year 2 monitoring activities are:
|
|
|
Post-Construction Water Quality Monitoring, South Creek at Campbell Avenue and Kansas Expressway, Springfield, Missouri
|
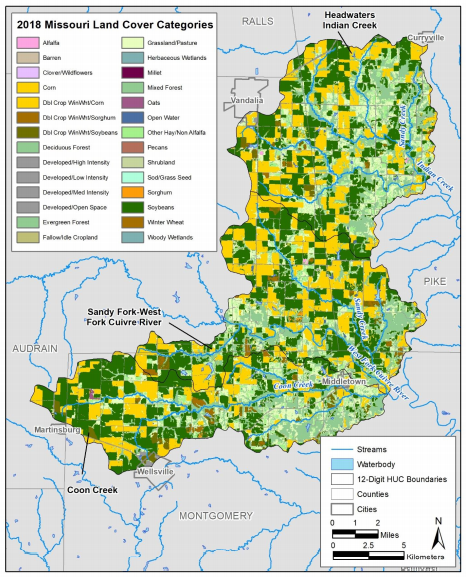
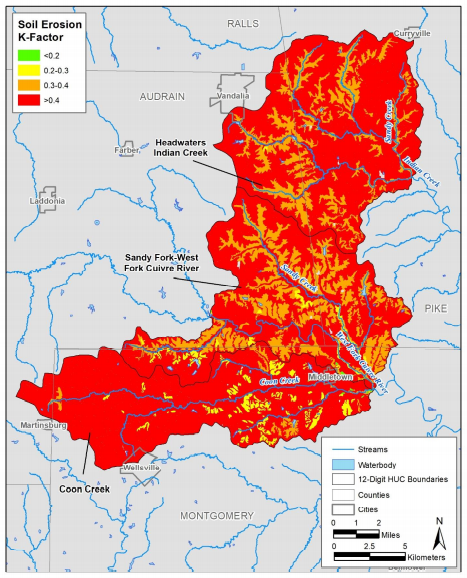
Mississippi River Basin Healthy Watershed Initiative (MRBI) Watershed Assessment for Section of the Cuivre River WatershedIn 2009, the U.S. Department of Agriculture through the National Resources Conservation Service (NRCS) implemented the Mississippi River Basin Healthy Watersheds Initiative (MRBI) aimed at reducing nutrients and sediment in the nation’s rivers and streams. The goal of the MRBI program is to develop nutrient reduction strategies that minimize the contributions of nitrogen and phosphorus to surface waters within the basin while ensuring the economic viability of agricultural lands. The goal of the MRBI program is to improve water quality, restore wetlands, and enhance wildlife habitat while ensuring economic viability of agricultural lands in high-priority watersheds within the Mississippi Basin. However, watershed-scale evaluations identifying specific pollution sources and the conservation practices needed to improve water quality are needed to aid field office staff responsible for working with landowners. Therefore, a comprehensive planning effort intended to prioritize specific landscapes, crop types, and the conservation practices available is needed to help NRCS field staff implement the MRBI program where it will be the most effective considering limited available resources.
Soil erosion and animal waste has been identified as major concern for water quality for streams within the Cuivre River watershed and water quality monitoring shows high levels of nutrients, bacteria, and suspended sediment. The purpose of this assessment is to provide NRCS field staff with the necessary information to identify locations within the watershed where soil, slope, and land use practices have the highest pollution potential and to describe conservation practices that can be the most beneficial to improve water quality. The specific objectives of this assessment are to:
|
|
Mississippi River Basin Healthy Watershed Initiative (MRBI) Watershed Assessment for Section of the Lower Grand Watershed: Priority Rank Model
Goals and Objectives
The purpose of this report is to provide the Missouri State office of the NRCS the results of a watershed assessment study of three HUC-12 watersheds within the Lower Grand River, Turkey Creek, Spring Branch-Elk Creek, and Long Branch located in Linn, Chariton, and Sullivan Counties in Missouri. Ultimately, this watershed assessment provides NRCS field staff with the necessary information to identify locations within the study watersheds where soil, slope, and land use practices have the highest pollution potential and to describe conservation practices that can be the most beneficial to improve water quality.
This report incorporates management units, vulnerable acres, and runoff risk in the Lower Grand watershed. The goal of this priority rank model is to use various geoprocessing tools to build models from vulnerable acres and runoff risks from each management unit. The results of this model will establish a final score and rank fields where project areas should be implemented.
Methods
Part 1: Priority Rank
The data needed for Priority Rank Model includes:
- LG_ManagmentUnits.shp
- LG_VulnerableAcres.shp
- LG_RunoffRank.shp
Table 1. Priority ranks and variable definitions of each quantified ranks.
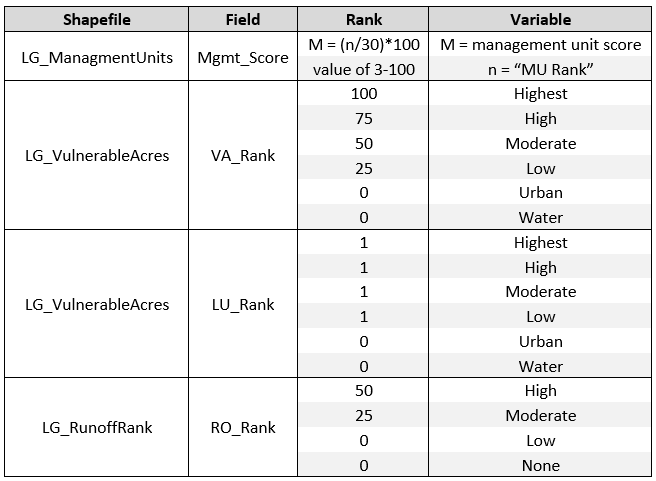
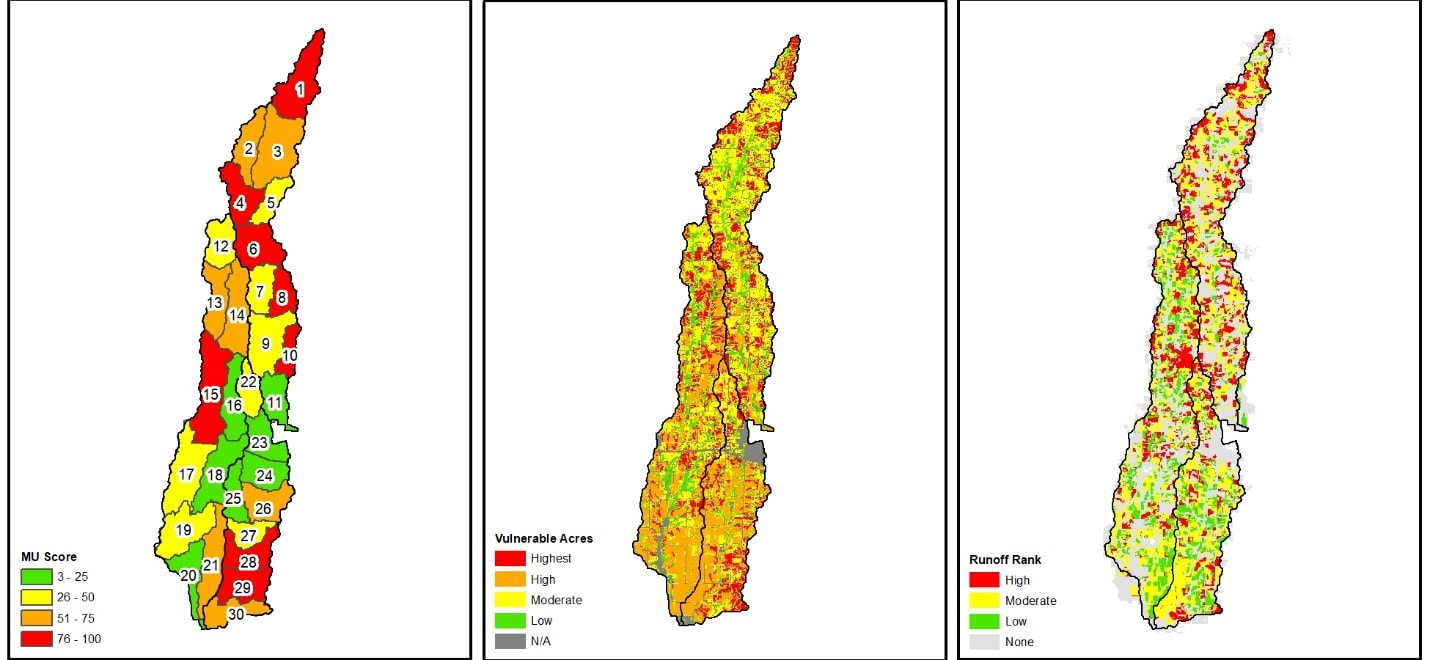
Figure 1. The ranks of each of the criteria for the Final Score in selected Lower Grand watersheds.
After each feature was ranked, the shapefiles were transformed into rasters by using the feature to raster tool (Figure 2). The areas established in the rasters were determined by the fields in Table 1. In order for the features to convert into rasters, they must be saved into a geodatabase.
Figure 2. Model showing the ranked features needed to be used in order to combine the rasters to get the rank model.
From there, the ranked rasters added together calculated in order to combine all the rasters to get a large ranking or what we will call the preliminary final score (Figure 2). The Raster Calculator created a score from the equation:
LG_RankModel = LG_MgmtScore + LG_VA_Rank + LG_RO_Rank
The final step includes the land use raster derived from the LG_VulnerableAcres.shp. Anything classified as urban or water (N/A) will be given a value of 0, and the others will be classified as a 1. This nulls values or gives them no value for areas that are not applicable to the priority ranking. The raster calculator will be used again to get the Final Score.
LG_RankScore = LG_RankModel * LG_Landuse
The final score ranges from 28 – 250. The Management Unit ID’s 1, 6, 15, 28, 29 contain the most areas that are identified as priority areas (Figure 3). Finally, the LG_FinalScore raster is converted to a polygon shapefile for easy sharing purposes.
Figure 3. Model showing the priority ranked areas throughout the entire watershed.
Figure 6. Weighted Rank Scores based on the field boundaries in HUC-12 Boundary.
|
Part 2: Weighted Field ScoreThe criteria for Field Rank Model includes:
Figure 4. Union tool used as one of the steps to get a weighted field score.
Create three fields in LG_FieldBoundary_Union.

Figure 5. Dissolve tool that uses statistics to create final weighted score.
The output will be called LG_FieldScore.shp (Figure 6). The weighted score will be found in the field named SUM_FieldScore. The maximum field score contains a value of 228, located in MU 1.
|
